User Guide
A complete tutorial regarding how to use GoSurvey. We have covered and explained everything related to the working of GoSurvey and its features.

How to view Scoring report?
The Scoring Report shows the score and average for questions that have scores set. For choice questions, each option has a score. For number and decimal questions, the score is set for a range of values. Rating, number scale, and NPS use the selected value as the score.
To view the Scoring Report, follow the steps below.
Step 1:
Login to GoSurvey admin site by using the same credentials that were set while creating the account. Once logged in, click on the Data menu.
Step 2:
The survey list opens with each survey and its response count. The Scoring Report column is where you open the score summary for that survey.
You can also open a survey from Responses, then click Scoring Report at the top of the response list.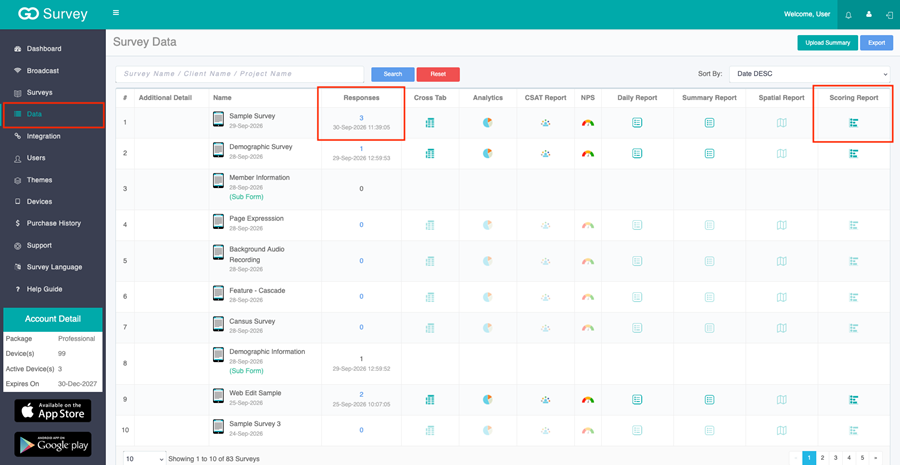
Step 3:
Click the Scoring Report icon for that survey.
The report title is Scoring Report. At the top, three totals are shown:
- Response — how many responses are included
- Score — the average score out of the maximum score
- Percentage — the average as a percentage of the maximum score
Each scored question is listed below, with its score as a percentage and as an average out of the maximum. Each option shows how many Responses chose it. Not Answered is the count of responses that skipped that question.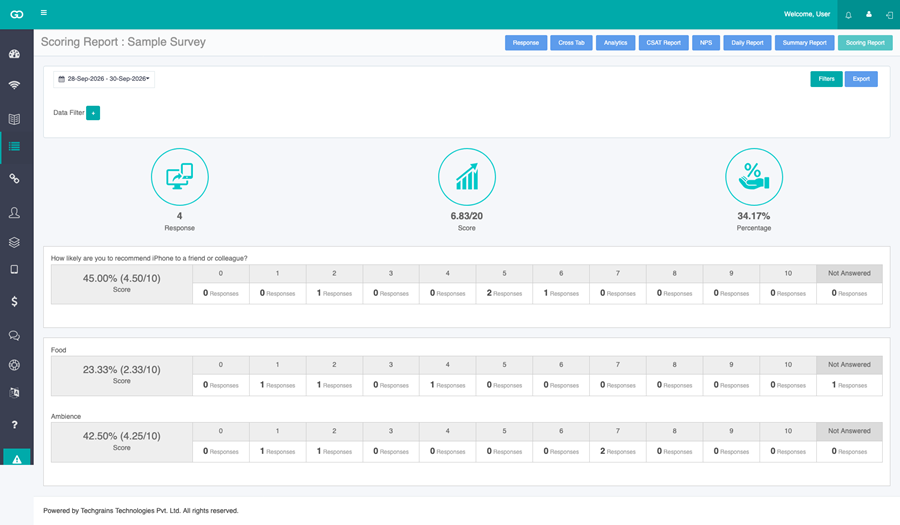
At the top left, open the date range and choose the start and end dates.
Click Filters. If Select User appears, choose a user to see only that user’s responses. Next to Data Filter, click + to filter by a question, operator, and answer.
Click Export to download the report as a PNG image.