User Guide
A complete tutorial regarding how to use GoSurvey. We have covered and explained everything related to the working of GoSurvey and its features.

How to view collected data?
The responses collected from mobile devices and/or web forms are stored in your account under the given survey.
To view the collected responses, follow the below steps:
Step 1:
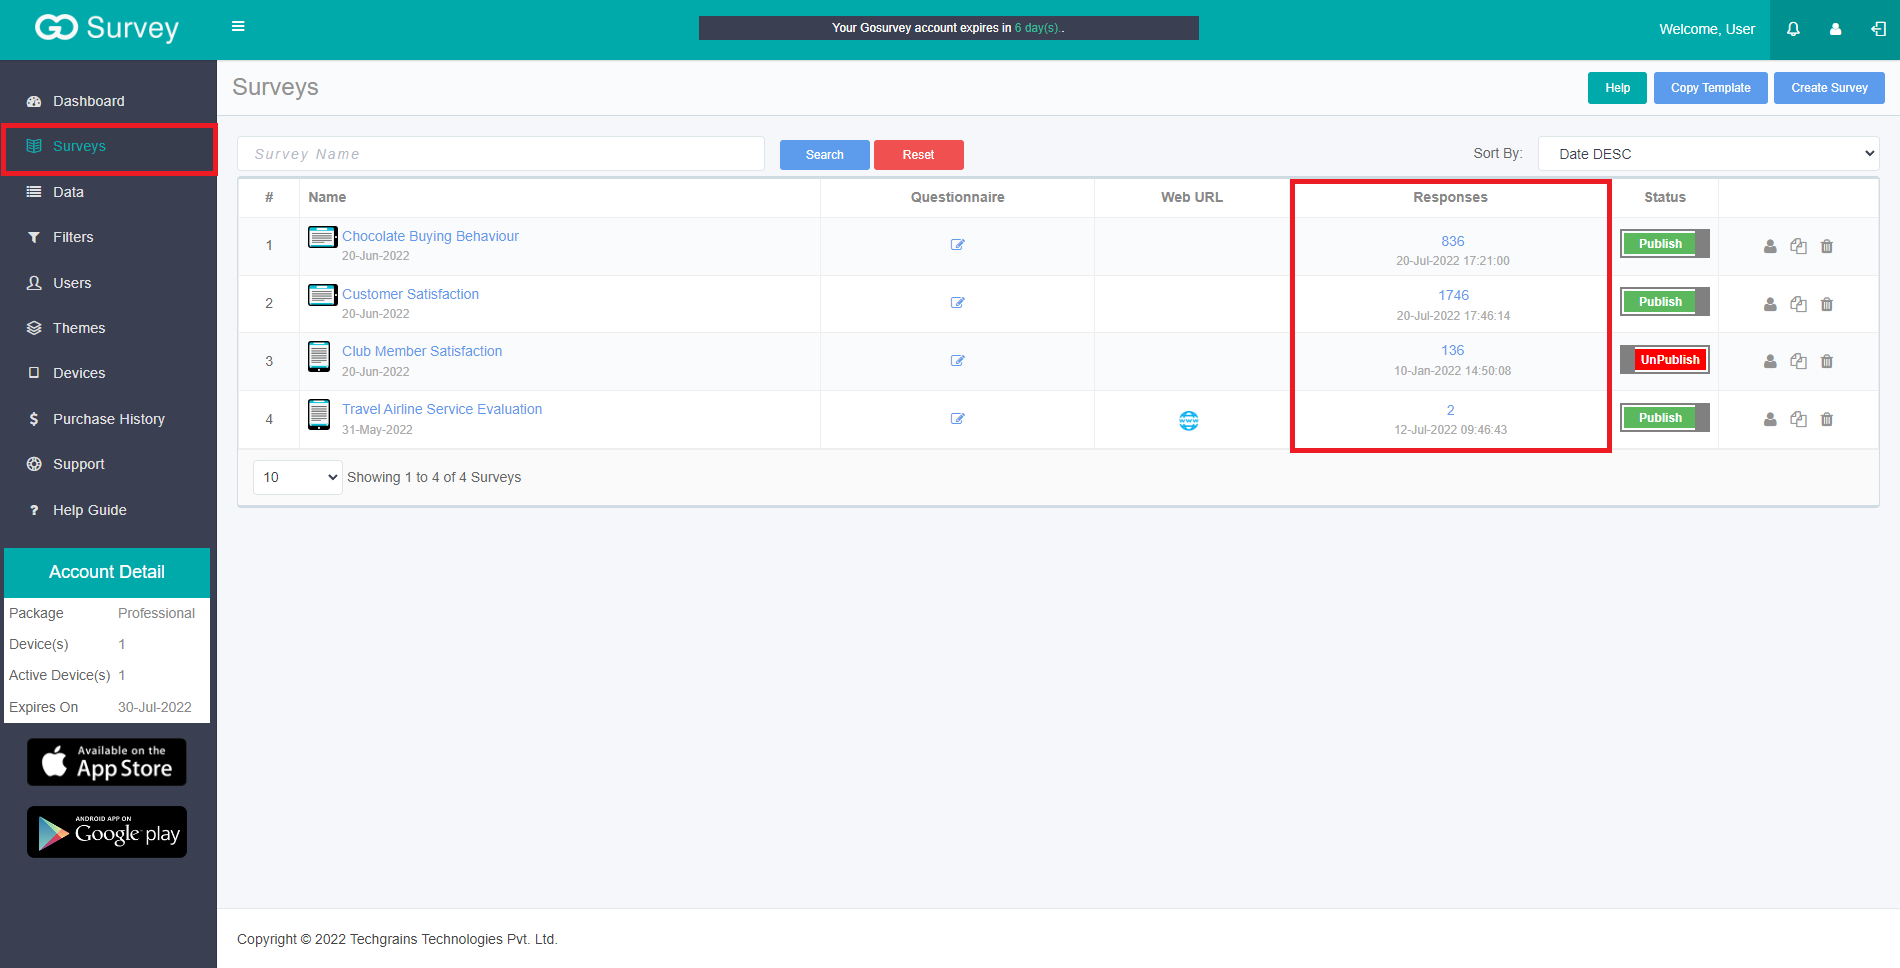
Click on the Surveys link on the left side panel. On the right hand panel there will be the list of surveys which the user has created.
The survey list will show the below information.
Name, Questionnaire, Responses and Status - here Responses show the number of response count collected for a survey
Step 2:
There are two ways to view a survey collected data - One is through ‘Responses’ and the other is through ‘Data’ on the left side panel.
-
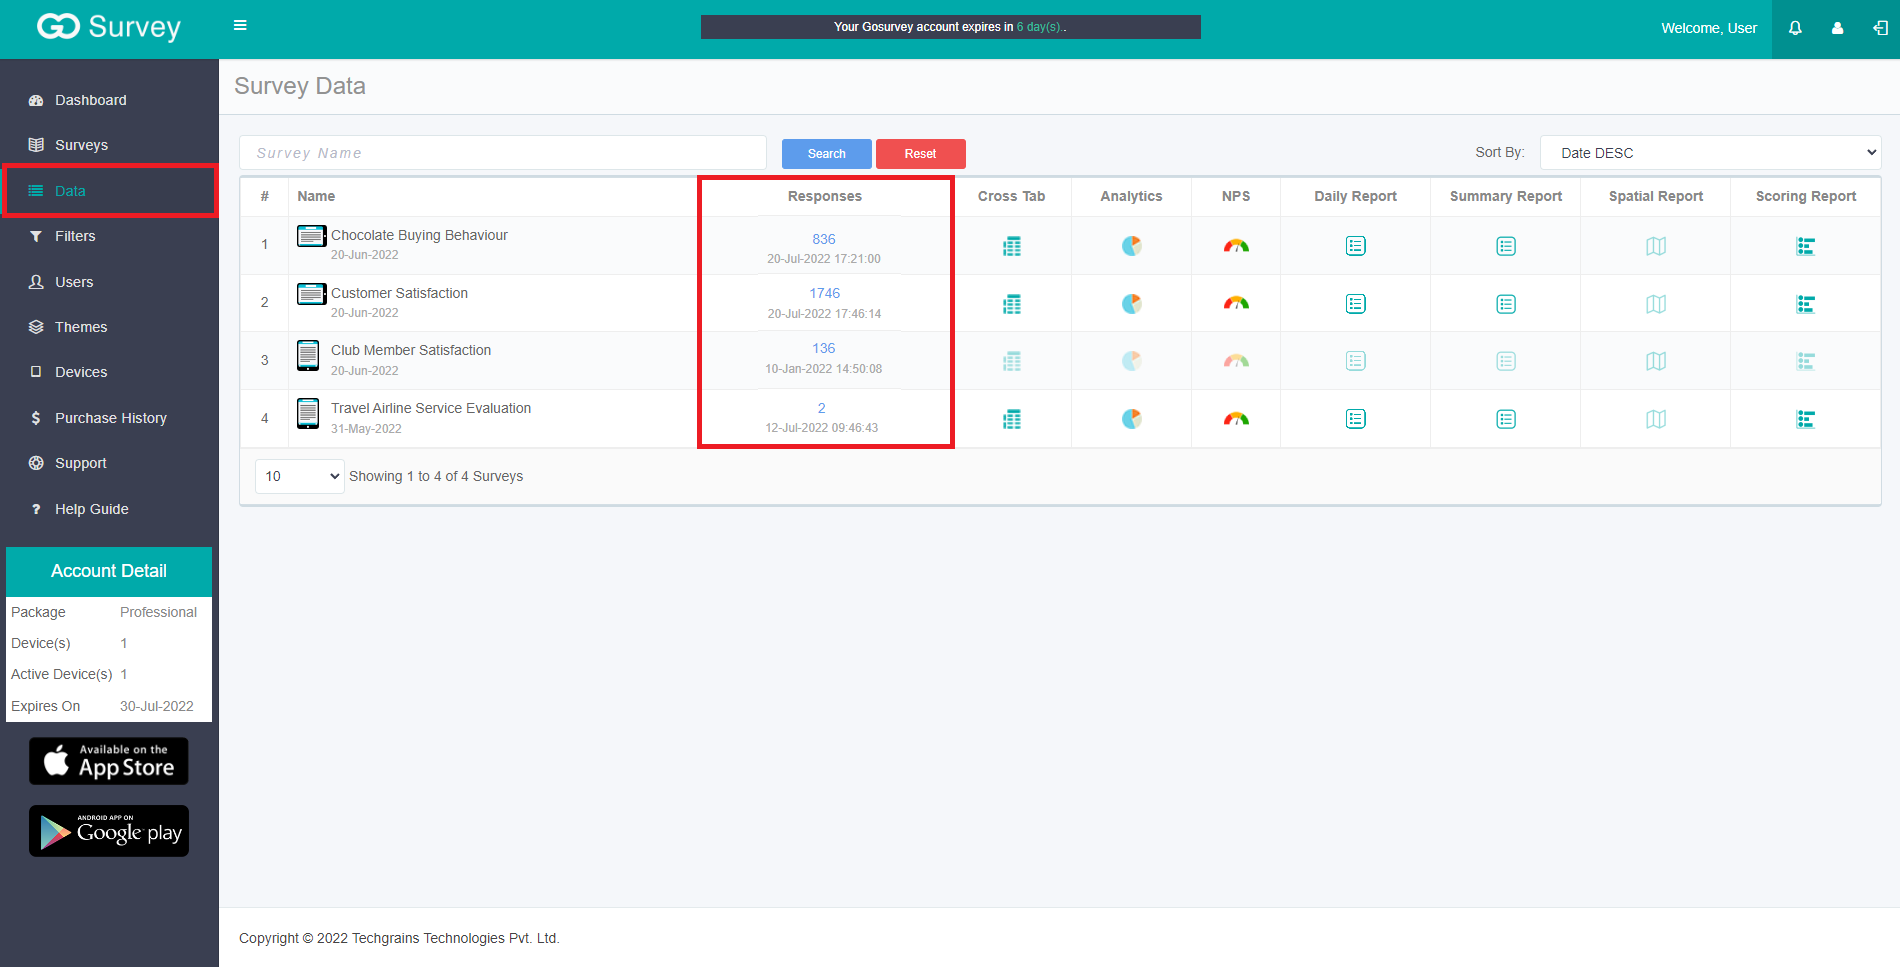
From ‘Data’, user can view all different forms of collected data directly - Responses, Analytics, NPS, Daily & Summary Report, Spatial Report, Scoring Report.
Below steps are for viewing data from ‘Responses’. -
Click on the Responses column of the particular survey to view the survey responses.
-
After clicking, a screen will appear with all the responses collected by the user till date.
-
At the top, there is a row of buttons linking to different data sets like Cross Tab, Analytics, NPS, Daily Report, Summary Report, Scoring Report, Spatial Report.

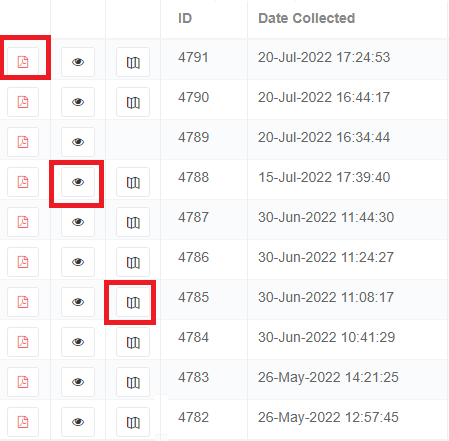
In the below panel it shows the responses with ID, Date Collected, by which user and the survey form details differentiates in columns.
The Filters panel has 3 fields:

- Date Range
User can select the date range for which he wants to see the data. Default range will be the day the user started collecting the data till the current date. - Filters
Shows the ‘Select User’ and ‘Data Filter’ which can be used to differentiate the responses, user wise and see the report on the basis of any question operator respectively. - Export The option to export the responses. On clicking the ‘Export button’, a dialogue box appears asking to select one from the given file formats of Xlsx, CSV, SPSS, PDF and an ‘Additional Options’ checkbox for a concise data file.
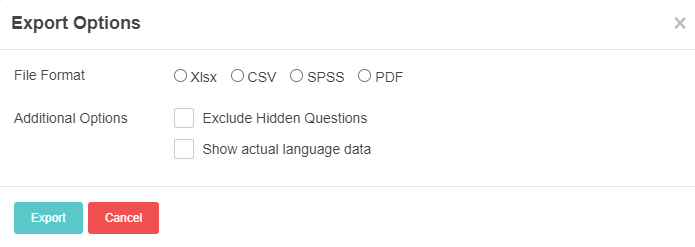
- In a similar manner, on clicking the dropdown next to ‘Export’, it lists down the same options(file formats) under Data Export.
- This list options shall vary depending on the plan and features you have opted for.
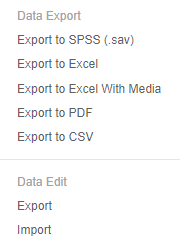
- Export to SPSS(.sav): User can export the data in SPSS.sav format.
- Export to Excel: User can export the report in excel format.
- Export to Excel With Media: User can export the data with media files.
- Export to PDF: User can export the data in PDF format.
- Export to CSV: User can export the Csv file of the collected responses.
- There’s also Data Edit under the Export dropdown having Export and Import option where user can export the file to edit the data file and use import to access the edited data file into the responses.
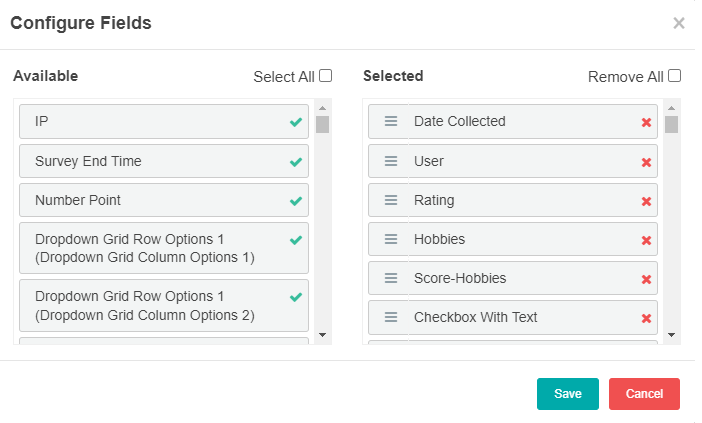
- Configure fields: User can configure the fields which will be present next to Export. Fields can be configured according to the user’s convenience.
- Below on the panel there are two icons:
- Save as PDF: By clicking the user can save the PDF file of the particular form.
- View
User can view the whole form by clicking that icon.